Studium BI Products
Industry
Ed-tech
Timeline
Jan 2025 - May 2025
Organization
Studium Tech
My Role
Business Intelligence & Strategy
Team
1 External advisor, 1 developer, 2 interns, CEO
Type
Live project
Description
Studium's core product helped institutions manage university accreditations. We built a new module providing analytics from crucial data for the institutes, like Research, NIRF & Alumni data; which was later spun-off into separate products. This project involved Business Intelligence as well as Business Strategy, as it would help make Studium's conversion rate far better than it was. I lead this project & worked directly with the CEO on it.
The opportunity wasn't more data, it was making existing data useful
While exploring accreditation data, I noticed that institutions were already publishing large amounts of structured information through accreditation reports. The same data could potentially answer questions far beyond accreditation compliance.

Institute's NIRF Report

Some raw datapoints extracted from the report
Raw institutional reports give you data across:
Faculty
Research
Placements
Student outcomes
Infrastructure
1 institution
↓
20+ of datapoints
500+ institutions
↓
Enormous comparative dataset
From documents to datasets
The information existed, but it wasn't immediately usable. I had little to no idea about BI or data analytics, but the CEO saw potential in this. So we built a pipeline from start to end- I explored how to systematically extract, structure and compare data across institutions.
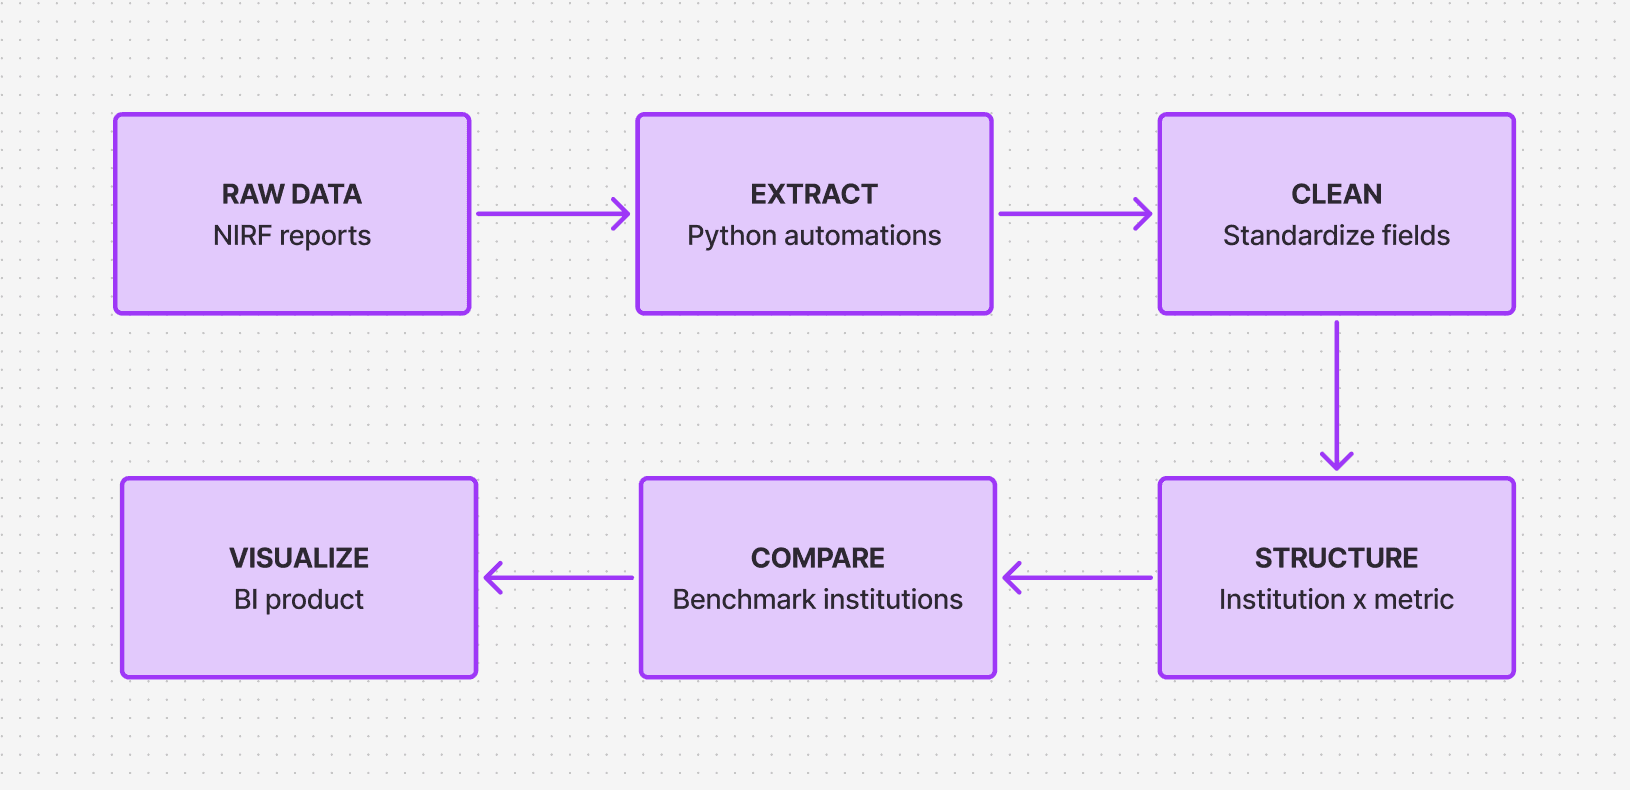
Compiled all the discipline-wise reports from the past years (Management, Research, etc.)
Extracted all relevant data out of the reports using python automations (needed some help from the developers here ;)
Took 50 odd raw datapoints, processed the data & output a comparative analysis of any institute across 20+ different metrics.
We worked with an advisor to figure out the front-end of this module, in a BI tool called Google Data Studio.
Thus, we had the first working prototype of the module ready.
If your institute had gone through the NIRF cycle, all you had to do was input the data from your report & you could compare yourself with the top 100 institutes in the country. It was an interesting, new value proposition for institute owners.
Before

After
One dataset revealed another opportunity
Similar to NIRF reports, research & alumni data also represented untapped opportunity. After NIRF, we found two more areas to design similar modules. Due consent was taken from concerned stakeholders.
Research data could reveal an institution's academic standing beyond accreditation scores.

Some metrics we created:
No. of publications & types
h-index & i-index
Citations per faculty, publication & year
Top journals published in
Alumni career data offered a retrospective view of institutional outcomes—from education to employment.

Some metrics we created:
Geographical demographics
Industry-wise spread
Seniority
Major employers
Designing the information
Here are a few examples of information challenges we faced and how I chose to communicate the insights through visualizations:
Comparative performance
Question: Comparing a single parameter, where do you stand amongst the top 100 institutes in the country?
Visual: Parameter-wise comparison multi-line chart
Insight: How you compare against the best institutes on one single parameter.
Why this visual: The chart shows the value of the parameter for you (static line) and values for best institutes (plotted on another line) showing visually where you lie and how many institutes are above or under you.
Research profile
Question: What is the trend of research volume in the institute over the past years?
Visual: Type-wise publications per year stacked bar graph
Insight: Volume of publications and its trend can be correlated with policy decisions or funding, which gives a deeper view of how they influence each other in the institute.
Why this visual: Stacked graph shows the different types of publications from the faculty in every year at the same time, giving a comprehensive view of publication volume.
Alumni outcomes
Question: Which companies are most alumni currently working at?
Visual: Major employers of alumni bar graph
Insight: After a few years of graduating, people start to concentrate at a few top companies. Inviting them for on-campus hiring can fast-track career trajectories. Also counselling students about hiring requirements at these companies before-hand and connecting them with working alumni will help students gain a headstart.
Why this visual: This simple visual gives a clear picture of where your alumni are currently concentrated.
From information product to business opportunity
Once these modules demonstrated value to existing clients through pilots, a second question emerged: could they also help us solve a tricky business problem for Studium?

So we came up with a new GTM strategy:

Spin-off the BI modules all as standalone products.
Core product costed ₹X,XX,XXX but these smaller BI products would cost lower, proportional to the value they provided.
A lower ticket meant a principal could approve their purchase independently.
Fewer approvals meant a shorter sales cycle.
Once inside the ecosystem, the core product became easier to pitch for us.
This could accelerate Studium's conversion rate of the core product, which was the real money-maker.
Our existing clients showed good interest in these new products, validating the value they provided to the top management. So we went forward with the new GTM, eventually developing the products in code & moving away from Google Data studio.
Impact that we had
Top management now had a better picture of their institute's health on various crucial fronts like research & student progression.
Comparing with other institutes, they could set a benchmark that was right for them.
Institutes could now try out our products before spending huge amounts of money.
The business gained a new sales channel & GTM strategy.